

The Institute for Urban Economics launches a publication series entitled ‘Economies of Russia’s Cities and Metropolitan Areas’ on basic indicators of economic development of Russia’s cities and metropolitan areas. The project is being funded through the IUE Endowment.
This first issue focuses on a comparative analysis of 20 largest metropolitan areas (urban agglomerations or metro areas), by the size of their economies and also on assessment of the links between metropolitan economies and real estate as their main tangible (physical) assets.
To assess the size of a metro economy we utilized a new IUE’s technique for estimating gross metropolitan product of cities and metro areas[1].
Gross metropolitan product (GMP) is an indicator to measure the market value of goods and services produced in all economic sectors of a city during a year. GMP of a metropolitan area includes GMPs of all the cities within a given metro area. The indicator is estimated based on a method similar to the income approach method for GDP calculation with a number of assumptions made to compensate for the absence of a system of accounts at the city and metro levels from Russia’s statistical framework[2].
The indicators estimates were based on data from the Federal State Statistics Service (or Rosstat), state extra-budgetary funds, the Federal Tax Service, the Federal Treasury. International comparative analysis is informed by data from a joint project ‘Redefining Global Cities: the Seven Types of Global Metro Economies’ of the Brookings Institution, the world’s top think-tank, and JPMorgan Chase, a leader in investment banking, comprising a review of economies of global cities and metropolitan areas for the year 2015[3].
1. METROPOLITAN AREAS GMP RANKING
In 2015, 20 major metro areas accounted, overall, for about 40 percent of the national GDP, or 33 trillion rubles. They have population of about 49 million, which makes up 34 percent of the national population.
A list of the five largest metro areas showing GMP of more than 1 trillion rubles includes as follows (see figure 1):
- Moscow metro area (16.5 trillion rubles).
- St.-Petersburg metro area (4.2 trillion rubles).
- Nizhniy Novgorod metro area (1.12 trillion rubles).
- Yekaterinburg metro area (1.12 trillion rubles).
- Samara-Tolyatti metro area (1.07 trillion rubles).
Figure 1
20 MAJOR RUSSIA’S METROPOLITAN AREAS RANKED BY GMP
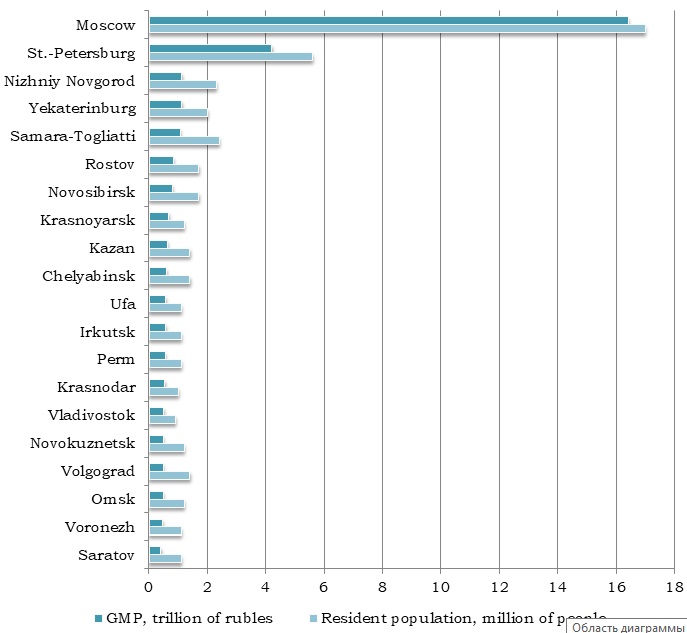
Source: IUE, estimates based on data from Rosstat, state extra-budgetary funds
2. METROPOLITAN AREAS GMP PER CAPITA RANKING
Only three major metro areas – Moscow, St.-Petersburg and Yekaterinburg – outpace the national average in total productivity of their economies (see figure 2).
There is an almost three-fold gap between the richest (Moscow) and the poorest (Volgograd) metro areas on this indicator.
Figure 2
METROPOLITAN AREAS GMP PER CAPITA RANKING, THOUSAND RUBLES, 2015 (FOR RUSSIA, THE NATIONAL AVERAGE GDP PER CAPITA)
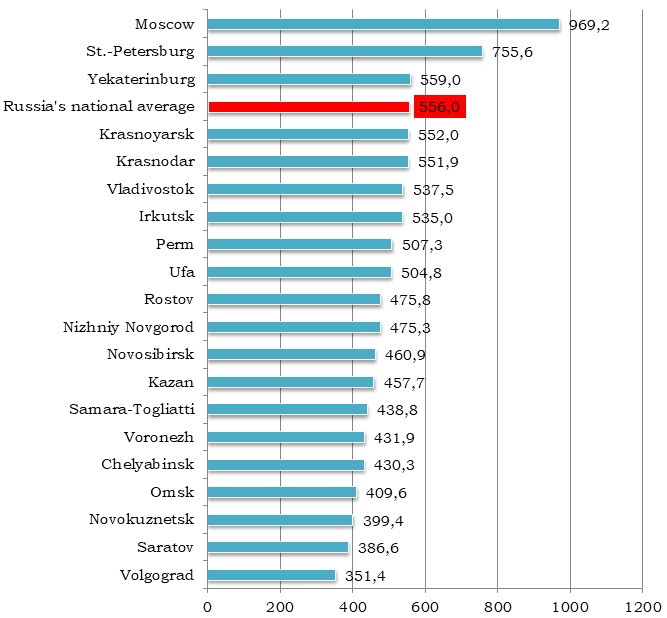
Source: IUE’s estimates based on data from Rosstat, state extra-budgetary funds
3. RUSSIA’S AND THE WORLD’S METROPOLITAN AREAS
Russia’s economy ranks 6th in the world in terms of GDP. The 2015 GDP, in Russia, was 3.9 trillion international dollars based on purchasing power parity[4].
In terms of per capita GDP Russia comes 48th in the global ranking. The 2015 GDP per capita, in Russia, was 22.6 thousand international dollars[5].
How do Russia’s major metro areas perform compared with their global peers?
By the size of their economies only two Russia’s metro areas – Moscow and St.-Petersburg - can compete with global metros. Moscow’s economy is half that of New York (747 and 1,492 billion international dollars, respectively)[6]. The economies of Novosibirsk and Yekaterinburg, however, fail to reach even the scale of Cape Town’s economy (see table 1).
Yet, smaller-sized Russia’s cities could be more productive. Is that the case? Let us look at GMP per capita figures.
Most metro areas in Russia show the annual level of 20-25 thousand international dollars per capita, which are the closest figures to those for Mexico and Sᾶo Paulo. St.-Petersburg metro area – with per capita GMP at about 35 thousand international dollars per capita - is comparable to that of Seoul.
The most developed Moscow metro area shows a per capita GMP at 44 thousand international dollars per capita, which is almost half the level hit by Singapore and New York.
Table 1
GMP AND GMP PER CAPITA IN THE WORLD’S AND RUSSIA’S[7] METROPOLITAN AREAS, THOUSAND INTERNATIONAL DOLLARS PER YEAR, 2015
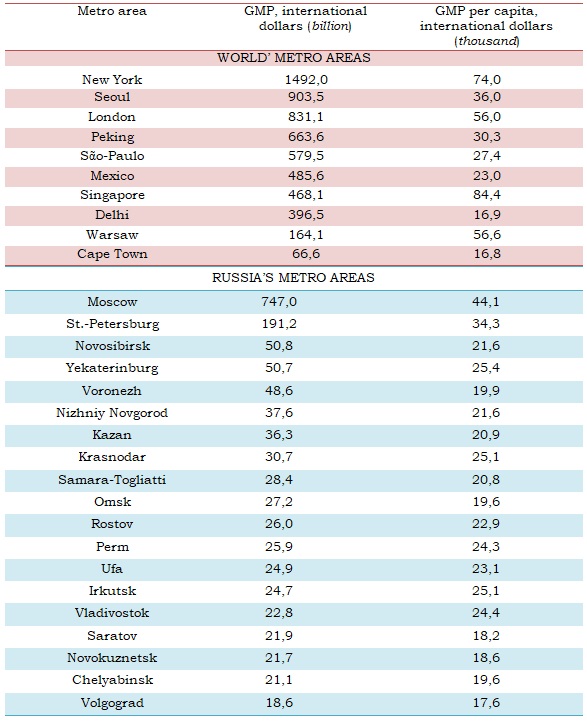
Source: For Russia’s metropolitan areas the calculations were made by the IUE based on data from Rosstat, state extra-budgetary funds; for the worlds’ metropolitan areas the data were drawn from a study ‘‘Redefining Global Cities: the Seven Types of Global Metro Economies’’ conducted by the Brookings Institution and JPMorgan Chase
4. METROPOLITAN ECONOMIES AND ASSETS
Metropolitan tangible (physical) assets are real estate and infrastructure. These are the assets which provide the basis for developing all sectors of a metropolitan economy and for creating the enabling environment for comfortable living of city inhabitants. It is for that reason that public expenditures – and also, commonly, those for the development of urban infrastructure - are ordinarily financed worldwide by cities from real-estate tax revenues. In the long run, a simple economic mechanism comes into play whereby the growing value of metropolitan assets powers the growth of budget revenues.
In Russia, real-estate taxes are divided, for now, not only according to assets subject to tax (land and buildings) but also to the type of a taxpayer (individuals and legal entities) and to the budget level where they are directed to (land tax and individual property tax go to municipal budgets, while corporate property tax – to regional budgets).
Russia’s corporate property tax is, therefore, artificially excluded from the economy of a city which is not entitled to receiving the revenue from the aforesaid tax; though de facto its economy generates the relevant tax base.
Twenty major metro economies in Russia jointly generate about 275 billion rubles in corporate property taxes, or 39 percent of the national total[8]. In relative terms, however, the level of taxation differs significantly.
The most stringent tax conditions for business appear to be in the city of Yekaterinburg where local businesses paid in 2015 17 billion rubles – which accounts for 1.5 percent of the metro’s GMP - to the regional budget (Sverdlovsk Oblast) (see figure 3).
The Moscow metropolitan area, though ranked first in the total amount of tax revenues (115 billion rubles in 2015), provides the most favorable tax environment for businesses in terms of a tax burden; in fact, the proportion of corporate property taxes in the total GMP makes up a mere 0.7 percent in the given metro area.
Figure 3
METROPOLITAN AREAS RANKED BY THEIR CONDITIONS OF CORPORATE PROPERTY TAXATION, 2015
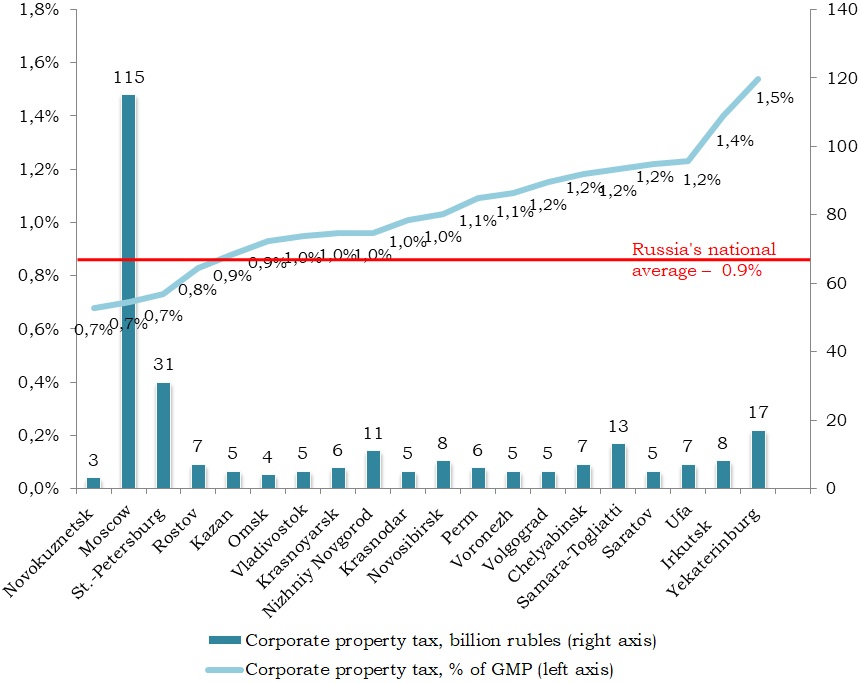
Source: IUE’s calculations based on data from Rosstat, state extra-budgetary funds, the Federal Tax Service
Compared with many other countries the Russian jurisdiction provides relatively soft conditions with regard to property taxation. On the whole, according to the Federal Treasury[9], in 2015, the total revenue of Russia’s consolidated budget, generated from property and land taxes, was 928 billion rubles, or about 1.1 percent of GDP, including 712 billion rubles, or 0.9 percent of GDP, received from the corporate property tax. In OECD countries the indicator shows 2 percent, and in the USA – 3 percent (see figure 4).
Figure 4
PROPERTY TAXES IN RUSSIA AND IN THE WORLD, 2015, AS A SHARE OF GDP

Source: Russia, the Federal Treasury, available at the following link: http://www.roskazna.ru/ispolnenie-byudzhetov/konsolidirovannyj-byudzhet/; OECD and USA ‘OECD Revenue Statistics 2016’, available at the following link: www.oecd.org/tax/revenue-statistics-united-states.pdf; Great Britain, available at the following link: http://www.abcmoney.co.uk/2016/12/14/oecd-confirms-uk-property-taxes-the-highest-of-all-countries/
As was already mentioned above, corporate property taxes in no way go to cities’ budgets. Now, let us assess whether the tax contributes to the development of a city’s economy – and the other way around – whether the level of economic development of a city has an impact on the flow of tax revenues?
As it can be seen in Figure 5, there is no correlation between tax revenues from metro assets in the form of corporate property – including real estate such as shopping malls, offices, warehouses, and industrial buildings – and GMP of those metropolitan areas where the above-listed assets are located.
Figure 5
GMP PER CAPITA AND CORPORATE PROPERTY TAX COLLECTION RATE PER CAPITA IN METROPOLITAN AREAS, 2015
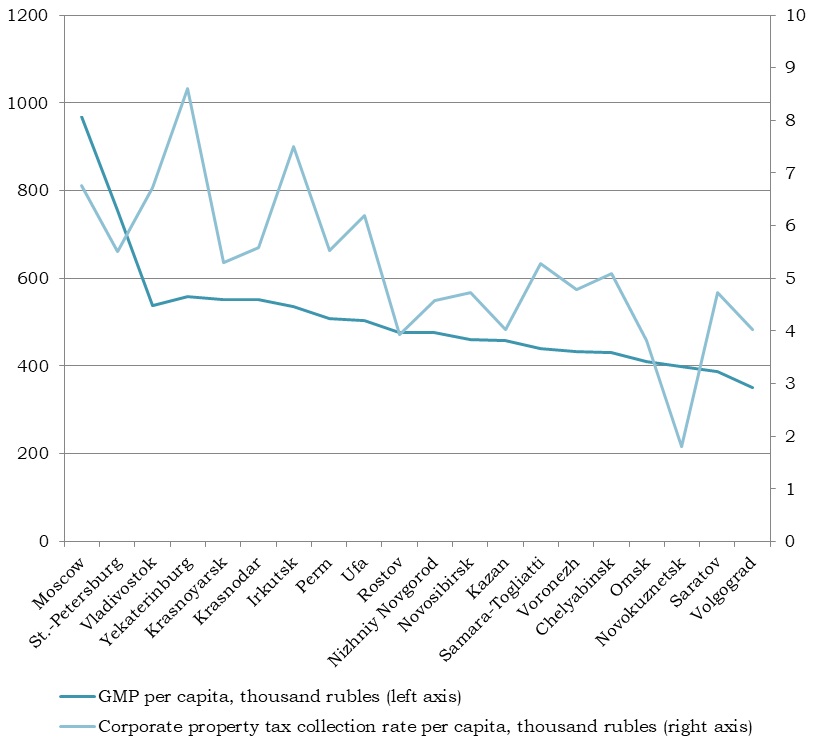
Source: IUE’s calculations based on data from Rosstat, state extra-budgetary funds, the Federal Tax Service
In Moscow and Vladivostok metro areas, for instance, the tax collection rates for the relevant regional budgets were the same: 6.7 thousand rubles per capita. The level of economic development in terms of GMP per capita, however, in the two metros varies with an almost two-fold difference between them.
Therefore, higher corporate property tax revenues do not encourage the development of a metro’s infrastructure or a GMP growth, and, vice versa, a higher level of metropolitan economic development does not generate guaranteed additional budget revenues. This means that, even in the major Russia’s metro areas, one of the main transmission mechanisms appears to be dysfunctional.
These distortions are induced, mainly, by three factors:
- distortions in a tax base which is determined according to a book value rather than to a fair market value; this stems largely from a patchy reform designed to ensure the transition to market-based taxation of real estate assets at cadaster value;
- cities are not entitled to pursue their own policies with regard to taxation of corporate real estate property as this falls within the authority of the constituent entities, or subjects of the Russian Federation;
- inconsistency between the tax policies of RF subjects with regard to corporate real estate property and the policies implemented by the cities with regard to administering the tax – including through town-planning management – along with a failure to streamline them according to economic conditions in the cities.
Considering that in Russia corporate property tax revenues go to regional budgets it appears to be impossible to properly estimate what share of the revenues subsequently returns to metro economies in the form of intergovernmental transfers to municipalities located within the limits of a metro area. However, we can estimate the share of potential tax revenues lost by central cities’ budgets within a metro area (see table 2).
The highest loss of tax revenues as a share of its annual budget, for instance, is reported for the city of Irkutsk. The city’s economy generates 7.3 billion rubles in corporates property taxes for the regional budget of Irkutsk Oblast – the amount which is commensurate with half the city’s budget.
Russia’s central cities located within 18 major metro areas lose 27.5 percent of budget revenues, except for Moscow and St.-Petersburg which are the subjects of the Russian Federation and receive corporate tax revenues in full.
Table 2
CITY BUDGET REVENUES[10] AND CORPORATE PROPERTY TAX IN CENTRAL CITIES OF METROPOLITAN AREAS, 2015
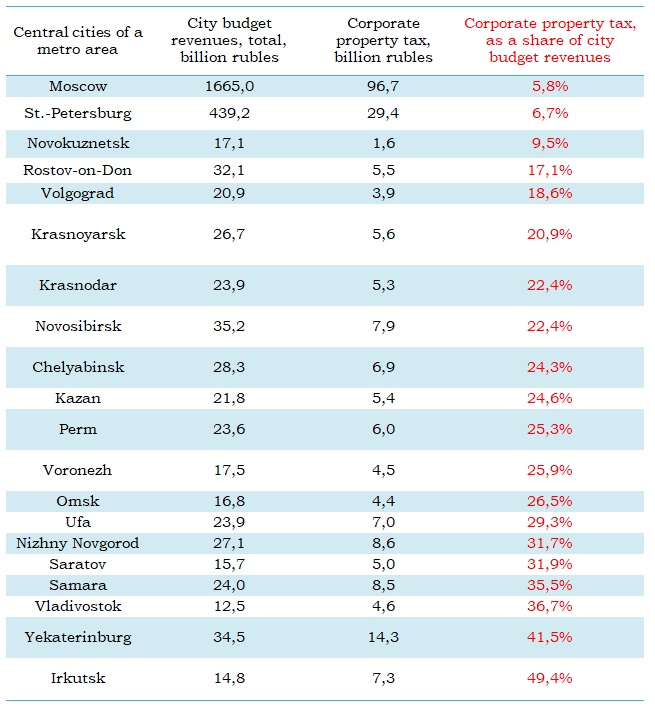
Source: IUE’s calculations based on data from the Federal Treasury and the Federal Tax Service
[1] Methodology of GMP calculation is presented at IUE web-site, section ‘Analytics’
[2] The System of National Accounts is used to estimate GDP in most countries, including in Russia. In Russia, however, similar system is unavailable for other levels of economy, including for metro-level economies
[3] Follow the link to the research: https://www.brookings.edu/wp-content/uploads/2016/09/metro_20160928_gcitypes.pdf
[4] Source: IMF
[5] Ibidem
[6] Figures for the world’s cities are provided for their metropolitan areas or similar municipalities linked by economic ties, with borders usually close to those of really existing metropolitan areas. For more detailed information, please refer to a study ‘Redefining Global Cities: the Seven Types of Global Metro Economies” carried out by the Brookings Institution and JPMorgan Chase. The study is available at the following link: https://www.brookings.edu/wp-content/uploads/2016/09/metro_20160928_gcitypes.pdf
[7] Estimates based on purchasing power parity of the Russian ruble, as utilized by the IMF
[8] Calculations based on the 2015 data from the Federal Tax Service
[9] Data is available at the following link: http://www.roskazna.ru/ispolnenie-byudzhetov/konsolidirovannyj-byudzhet/
[10] Moscow and St.-Petersburg – budgets of federal cities, subjects of RF; other cities – municipal budgets
ECONOMIES OF RUSSIA’S CITIES AND METROPOLITAN AREAS ISSUE #1: DO METROPOLITAN ASSETS WORK TOWARDS THE DEVELOPMENT OF CITIES?
