


This review continues the series of publications on basic indicators of economic development of Russia’s cities and metropolitan areas. The indicators have been united under a general name “Economies of Russia’s Cities and Metropolitan Areas”. The project is being funded through the IUE Endowment.
The issue focuses on a comparative analysis of capital cities, or administrative centers of the Russian Federation constituents, and also the cities of Moscow and St.-Petersburg, carried out in terms of their Gross Metropolitan Products (GMP), their contribution to economic development of the RF constituents and the country on the whole. The issue is also dedicated to assessment of the links between the level of development and the structure of metropolitan economies and to testing a hypothesis about the role of housing construction as a driver of economic growth.
The review provides an analysis of the situation in 81 capital cities over the period from 2000 to 2015. [1]
The first issue IUE Metropolitan ranking: Do metropolitan assets work towards the development of cities? are available at a web-site of IUE.
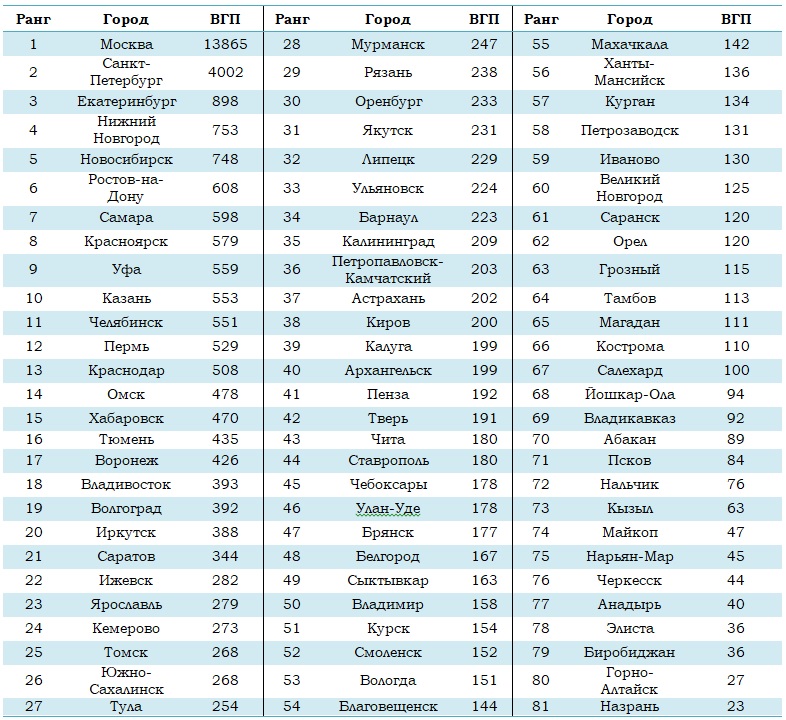
In 2015, the total GMP of 81 capital cities was 37.4 trillion rubles, or 46 percent of the total GMP. The CMP ranking of the capital cities is given in Table 1.
The GMP of Moscow, the major metropolitan economy was 13.9 trillion rubles[2], as compared with the smallest metropolitan area of Nazran with 23 billion rubles, that is, 602 times lower. Overall, 13 capital cities with the economies of over 0.5 trillion rubles produce almost 25 trillion rubles, or 67 percent of the total output of goods and services by all the capital cities.
Table 1
CAPITAL CITIES GMP RANKING, billion rubles per year, 2015
Regional capitals of the North and the Far East with commodity specialization come at the top five of capital cities GMP per capita ranking (see Table 2). Moscow ranks only 6th. St.-Petersburg, however, is not even in the top-10. It ranks only 12th.
Twenty-three metropolitan economies outpace the national average in GMP per capita being established at 556 thousand rubles per year, and 58 are lagging behind.
There is a fourteen-fold gap between the richest regional capital (Anadyr) and the poorest one (Makhachkala) on that indicator, which suggests a high degree of economic differentiation between capital cities.
Does it depend on the size of a capital city? Do major cities mean more successful cities in terms of GMP per capita, a traditional efficiency indicator?
Answering this question requires considering ten major cities in terms of the size of their population (see Table 3). Overall, it can be said that there is an upward trend in place: the bigger a capital city, the higher its GMP per capita. This indicates that agglomeration effects, specifically, the effects of urbanization economy manifest themselves in major capital cities to a large extent. This trend is also common in cities abroad. Russia is not an exception in this case.
It is important that benefits from economies of scale differ in the cities being considered because they depend on the structure of economy and its efficiency in certain sectors.
Indeed, the economies of Novosibirsk and Chelyabinsk have comparable levels of GMP per capita, though the latter is 25 percent less populated. At the same time, Rostov-on-Don, ranking 10th in the size of population, comes fifth in GMP per capita among capital cities. This means that the economies of scale in those cities manifest themselves differently due to different parameters of economic processes and to ability of cities to use their demographic potential as a source of economic growth.
Table 2
CAPITAL CITIES GMP PER CAPITA RANKING, (thousand rubles per year, 2015)
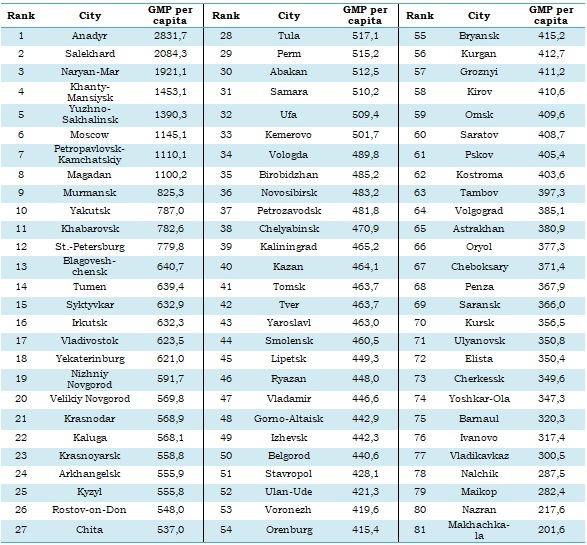
Source: estimates made by IUE based on data from Rosstat and state extra-budgetary funds.
Table 3
10 MAJOR CAPITAL CITIES: ECONOMIES OF SCALE IN METROPOLITAN ECONOMIES, 2015
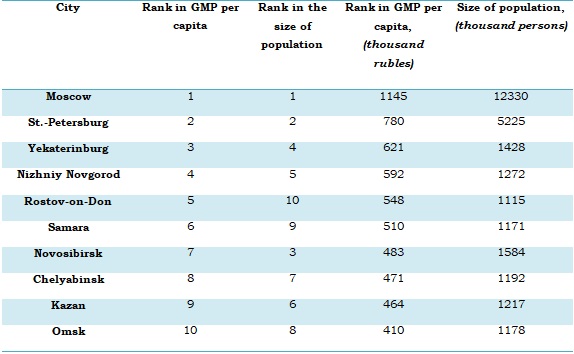
Source: estimates made by IUE based on data from Rosstat and state extra-budgetary funds.
3. ECONOMIES OF CAPITAL CITIES AND THE MACROECONOMY: PRO-CYCLICAL DEVELOPMENT
In the country’s economy, as in the economies of capital cities, there are two main phases – before and after the 2008 crisis.
Whereas prior to the crisis the capital economies have been growing much faster than the national economy on the whole – with a 14.3 percent increase, or 2.2 times faster, after 2008 the gap in growth disappeared (see Chart 1).
Resource-based impetus given to Russia’s economy development in the beginning of the 2000s promoted a multifold economic advancement of capital cities, where - due to multiplicative growth in demand – construction industry, commerce sector and other tertiary segments of the economy have been developing. But as soon as the external macroeconomic oil price shocks subsided and the crisis emerged, metropolitan economies – even in large capital cities – have not found any internal sources, others than those relying on resource-based sectors, so that to keep up with an acceptable pace of development.
Chart 1
ECONOMIC GROWTH IN THE NATIONAL ECONOMY AND THE ECONOMIES OF CAPITAL CITIES, GDP and GMP growth rates per capita, the average annual ratio
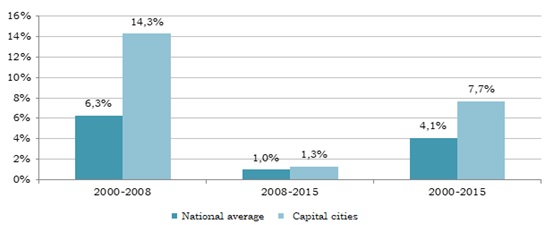
Source: estimates made by IUE based on data from Rosstat and state extra-budgetary funds.
Chart 2 shows the top five of the fastest growing capital cities – with a more than 10 percent increase in GMP per capita – Krasnodar, Naryan-Mar, Khabarovsk, Yuzhno-Sakhalinsk, Blagoveshchensk. Why do these cities lead? And what is the key to their success in contrast with other cities? Can this group of leaders be called stable?
First, a high volatility of the pace at which GMP per capita grew in the cities most likely suggests external factors and patchiness of the impetus for the development in extra growth periods and different levels of adaptability of metropolitan economies to adverse external influences during economic downturns.
For example, the rate of growth of GMP per capita in 2003 was 39 percent - the highest figure for the given year. But by 2005 the growth rate fell to 10 percent. Subsequent peaks and declines show down-trends. Blagoveshchensk demonstrates the opposite trend. In 2003 the city is an obvious outsider in the top-five, and in 2005 the city became a leader. The largest fluctuations in the growth rates were in Naryan-Mar. The peak of the growth rate at 26 percent in 2009 changed to a deep 39 percent decline in 2010.
Such volatility may be accounted for by extremely large external investments, in some years, which failed to create the multiplier effect for internal development in the chosen direction. For instance, even heavy investments in infrastructure of the XXII Winter Olympic Games, held in Sochi in 2014, failed to support the economy of Krasnodar, the capital city, as is evident from steadily declining rates of growth of GMP per capita during the period under review. Similarly, the expanded oil production in the Yamalo-Nenets Autonomous Area has not led to development of traditional consumer sectors in Naryan-Mar. This empirical evidence may be indicative of the lack of a mechanism enabling the transition of investments to future earnings, and then, to demand within a city or its related territories – whether it be investments in the capital city or in the region.
Secondly, the down-trends in the growth rates of GMP per capita – even the most fast-growing capital cities - also reveal their inability to develop counter-cyclically, which implies that the overcoming of a general downturn in the economy due to the deterioration of commodity markets conditions, trade and financial sanctions, or other macroeconomic conditions common to the entire country, requires internal sources of development and competitiveness. This suggests that even the major capital cities have so far been unable to become the driving force behind economic development and ensure the advance growth ahead of a general macroeconomic cycle, thus providing for a new positive macroeconomic trend.
Chart 2
CAPITAL CITIES: GROWTH LEADERS, GMP PER CAPITA GROWTH RATES, % YoY, 2001-2015

Source: estimates made by IUE based on data from Rosstat and state extra-budgetary funds.
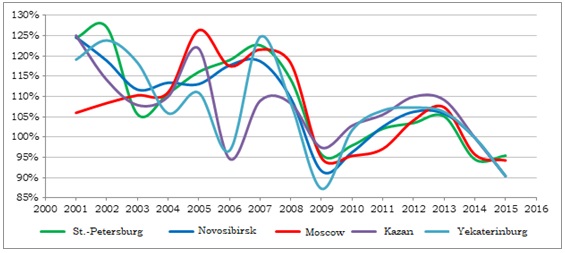
The capital cities, which rank among the top-five in terms of the size of their population, follow a similar pattern – high volatility of GMP per capita growth rates, especially prior to the 2008 crisis. They also show a down-trend, albeit their economies follow much the same pattern (see Chart 3).
Among the five major capital cities St.-Petersburg has been keeping up its growth rates in the past 15 years, at an average of 8.4 percent per year, as compared with 7.5 percent in Novosibirsk, and about 6.5 percent in Moscow and Yekaterinburg.
The maximum decline in growth rates of the top five capital cities fell on the 2008 macroeconomic crisis, with the lowest growth rates in 2009. Other up-and-down cycles in the given cities have been local in nature, that is, not emerging as a result of macroeconomic effects. The cycles varied from year to year in different cities. The economies of Kazan and Yekaterinburg have seen the largest fluctuations. Both cities have gone through three up-and-down cycles. In 2015 they entered the forth cycle.
Chart 3
MAJOR CAPITAL CITIES, GMP PER CAPITA GROWTH RATES, % YoY, 2001-2015
Source: estimates made by IUE based on data from Rosstat and state extra-budgetary funds.
4. THE ROLE OF CAPITAL CITIES IN REGIONAL AND NATIONAL DEVELOPMENT
Overall, 81 capital cities have the population of 56.5 million people, which represent 38 percent of the country’s total population. In 2015, the economies of the cities were estimated at 37.4 trillion rubles, or 46 percent of GDP. Hence, the proportion of people who live in capital cities is 8 percentage points, or 20 percent, higher than the share of GDP produced by the cities.
By international standards, the gap looks rather impressive. This suggests that the economies of capital cities, in general, perform rather well in comparison with other cities and territories. For instance, in major world cities the gap makes up around 16 percentage points. (see Table 4).
Table 4
CONTRIBUTION OF SELECTED CAPITAL CITIES TO THE COUNTRY’S POPULATION AND GDP

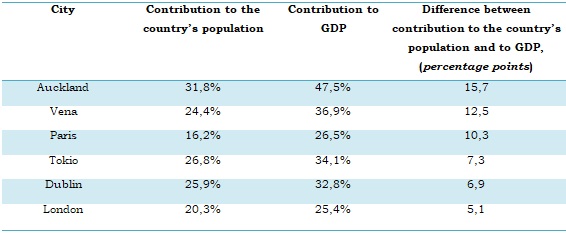
Source: Xing Quan Zhang. (2011). The Economic Role of Cities. The Global Urban Economic Dialogue Series: Nairobi.
In Russia only Moscow’s economy demonstrates similar difference – the share of Moscow’s GMP in the total Russia’s GDP prevails over the share of Moscow’s population in the country’s total population by 10.7 percentage points. For St.-Petersburg the prevalence makes up around 2 percentage points.
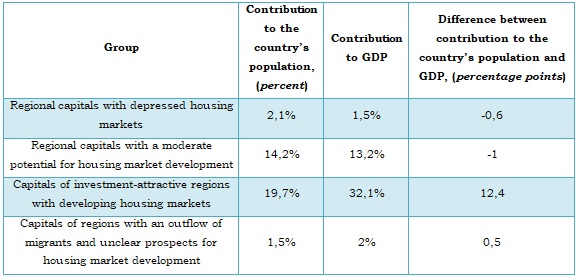
Table 5 gives the total contribution of capital cities in national GDP and population for the following groups of regions arranged according to their economic positon and housing market conditions[3]:
- Regions with depressed housing markets and deteriorated economic situation
(9 regions); - Developing regions with a moderate potential for housing market development
(39 regions); - Investment-attractive regions with rapidly developing housing markets (15 regions);
- Regions with an outflow of migrants and unclear prospects for housing market development (9 regions).
Only the capitals of investment-attractive regions show a significant positive gap at 12.4 percentage points between their contribution to the country’s GDP and population. The forth group – regions with an outflow of migrants and unclear prospects for housing market development – such as regions of the Far North and the Far East also show a small positive gap. In the first two groups, which comprise a vast majority of regions, the situation is quite reverse.
Table 5
ECONOMIC DISPARITY BETWEEN REGIONS AND THEIR CAPITALS’ ECONOMIC PERFORMANCE GAP, 2015

Source: estimates made by IUE based on data from Rosstat and state extra-budgetary funds.
As for a capital city’s contribution to the development of their regions, it accounts for an average of around 55 percent of the total regional gross product (GRP), and 36 percent terms of the total regional population.
The major capital cities with the highest GDP per capita, such as Moscow (81%), St.-Petersburg (82%), Omsk (77%), Novosibirsk (76%), and also the cities with less developed economies, such as Ulan-Ude (87%), Birobidzhan (81%), Elista (77%), contributed most to the economies of their regions (GRP).
The least contribution to GRP was made by the capitals of the RF constituents specializing in mining activities – Khanty-Mansyisk (4%), Salekhard (6%), Naryan-Mar (21%) – and also the capitals of the regions with developed non-resource sectors – Krasnodar (21%), Belgorod (26%), Kazan (30%). (See Chart 4).
Chart 4
CONTRIBUTION OF CAPITAL CITIES TO REGIONAL POPULATION AND GROSS REGIONAL PRODUCT (GRP)[4], (in percent), 2015
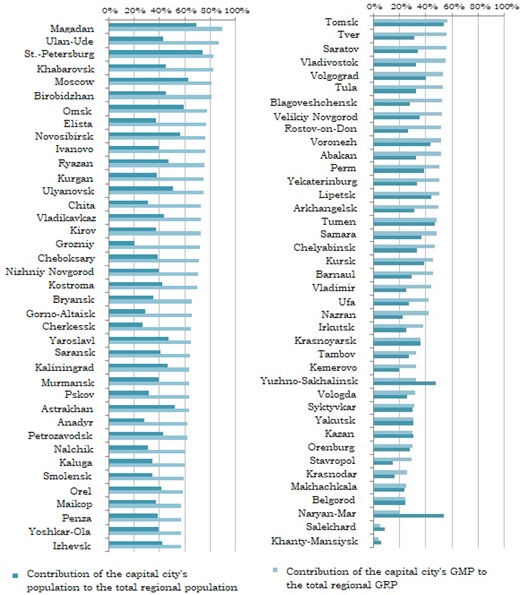
Source: estimates made by IUE based on data from Rosstat and state extra-budgetary funds.
And only in five regions the capital cities are less productive as compared with the regional average. These are Naryan-Mar, Salekhard, Khanty-Mansyisk, Yuzhno-Sakhalinsk and Yakutsk. In terms of GMP per capita, however, these cities are leaders on a national scale.
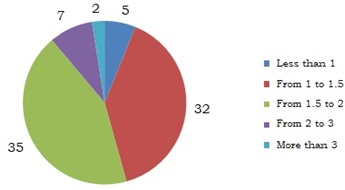
In 32 RF constituents, GMP per capita is less than 50 percent higher than GRP per capita. In 35 RF constituents it was from 50 percent to 100 percent higher. And a further 9 regions show a more than two times gap in economic wellbeing in capital cities and other territories (see Chart 5). Interestingly, a wide gap between GMP and GRP may indicate a difference between the economic performance of a capital city and a region and also show a low level of regional development.
Chart 5
DISTRIBUTION OF THE TOTAL NUBMBER OF REGIONS AND THEIR CAPITALS BY THE RATIO OF GMP PER CAPITA TO GRP PER CAPITA (times), 2015
Source: estimates made by IUE based on data from Rosstat and state extra-budgetary funds.
5. IS THERE A LINK BETWEEN THE STRUCTURE OF A METROPOLITAN ECONOMY AND ECONOMIC PERFORMANCE?
It would also be interesting to assess the impact of the structure and character of the economy on the level of total earned revenues in the economy.
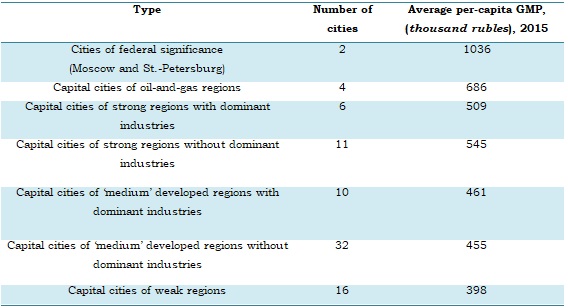
Let us consider 7 economy types of capital cities (see Table 6)[5]. In general, a GMP per capita for a capital city is correlated with the level of a region’s development. However, within the groups having the same level of development such fact as presence or absence of dominant industries would have different impact. For instance, the capital cities without dominant industries, which fall within the group of strong regions’ capitals, show a GMP per capita, which is 7 percent higher. But in the group of capitals of ‘medium’ developed regions the presence or absence of dominant industries has no significant impact on economic performance.
This may be explained by the fact that in big capital cities other (non-industrial) sectors – such as real estate, commerce, business services - contribute better to economic development. In ‘medium’ developed regions the territories of their capitals are not in high demand with non-industrial sectors, and the remaining industries fail to ensure the average national level of economic performance due to their weak competitiveness.
Table 6
ECONOMIC TYPES OF CAPITAL CITIES
Source: estimates made by IUE based on data from Rosstat and state extra-budgetary funds.
6. HOUSING CONSTRUCTION AS A DRIVER OF ECONOMIC DEVELOPMENT: MYTH OR REALITY?
One of the most frequent arguments being used in expert discussions on economic development of the country concern a particular role of construction sector, including housing construction, as a driver of economic development. Generally, the argument draws upon a potential ability of the sector to create the multiplier effects for increasing consumer demand in the economy. Is the hypothesis confirmed by empirical evidence? What is the direction of causality: does it a construction industry that has a positive impact on GDP, implying a supply-led approach, or GDP on a construction industry, meaning a demand-led approach?
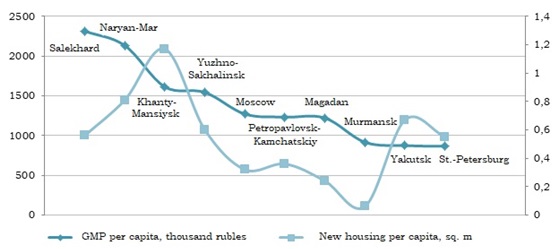
Chart 6 shows the data about per capita level of new housing in 10 capital cities with the highest GMP per capita. As is evident from the figures below, the causality sought has not been found. What could this be attributed to?
Chart 6
GMP PER CAPITA AND NEW HOUSING PER CAPITA IN 10 CAPITAL CITIES WITH THE HIGHEST GMP PER CAPITA, 2013
Source: estimates made by IUE based on data from Rosstat and state extra-budgetary funds.
For one thing, a city’s household income – related to the level of GMP – is not always reflected in the demand for goods and services in a city. For example, living conditions in some rich cities – Murmansk or Magadan - are not attractive enough for people to invest in residential property. In this case, household income creates demand for housing in other cities with more favourable living conditions, for example in Krasnodar.
For another thing, in addition to economic factors, housing production is constrained by town planning, regulatory and administrative factors. Under strongly limited supply the high housing demand driven by high GMP is more likely to boost prices rather than increase the supply of new housing, which is typical to the markets with low elasticity of supply. In the top-10 cities, the most illustrative examples of the situation are Moscow and St.-Petersburg.
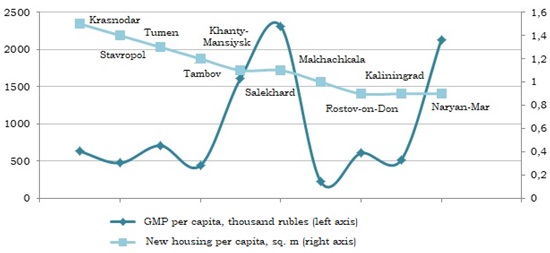
Chart 7 presents the capital cities with the highest figures of new housing per capita. Most of them have low GMP per capita – at about the average national level. Firstly, a housing market in southern regions is attractive to people from across the country. Secondly, fast pace of construction is often accounted for by a ‘soft’ town planning policy which entails as follows:
- Absence of tight constraints to sporadic and high-density high-rise development without an infrastructure within the existing city boundaries, and also to comprehensive development of suburban areas;
- Absence of strict town-planning regulations limiting the scope, number of floors and density of construction projects in a city;
- Weak town-planning and land supervision in respect of unauthorized construction.
Chart 7
GMP PER CAPITA AND NEW HOUSING PER CAPITA IN 10 CAPITAL CITIES: LEADERS OF NEW HOUSING CONSTRUCTION, 2013
Source: estimates made by IUE based on data from Rosstat and state extra-budgetary funds.
ANNEX
Economic types of capital cities
|
Group |
Cities |
|
City of federal significance |
Moscow, St.-Petersburg |
|
Capital cities of oil-and-gas regions |
Naryan-Mar, Salekhard, Tumen, Khanty-Mansiysk |
|
Capital cities of strong regions with dominant industries |
Krasnoyarsk, Lipetsk, Perm, Samara, Ufa, Yaroslavl |
|
Capital cities of strong regions without dominant industries |
Belgorod, Yekaterinburg, Kazan, Kaliningrad, Murmansk, Nizhniy Novgorod, Novosibirsk, Petrozavodsk, Syktyvkar, Tomsk, Yakutsk |
|
Capital cities of ‘medium’ developed regions with dominant industries |
Volgograd, Vologda, Voronezh, Izhevsk, Kemerovo, Omsk, Tula, Ulyanovsk, Khabarovsk, Chelyabinsk |
|
Capital cities of ‘medium’ developed regions without dominant industries |
Abakan, Arkhangelsk, Astrakhan, Barnaul, Blagoveshchensk, Bryansk, Velikiy Novgorod, Vladivostok, Vladikavkaz, Vladimir, Irkutsk, Kaluga, Kirov, Kostroma, Krasnodar, Kursk, Magadan, Nalchik, Oryol, Orenburg, Penza, Pskov, Rostov-on-Don, Ryazan, Saratov, Smolensk, Stavropol, Tambov, Tver, Ulan-Ude, Cheboksary, Yuzhno-Sakhalinsk |
|
Capital cities of weak regions |
Anadyr, Birobidzhan, Gorno-Altaisk, Grozniy, Ivanovo, Yoshkar-Ola, Kurgan, Kyzyl, Maikop, Makhachkala, Nazran, Petropavlovsk-Kamchatskiy, Saransk, Cherkessk, Chita, Elista |
1] In 2017 the Russian Federation comprised 85 constituent entities, including 3 cities of federal significance – Moscow, St.-Petersburg and Sebastopol. The city of Simferopol, a city of federal significance and the administrative center of the Republic of Crimea, is not being considered in this analysis due to the lack of necessary data. Besides, the Moscow Region and the Leningrad Region have no administrative centers. The analysis, therefore, was carried out in respect of 81 capital cities, including 79 administrative centers of the Russian Federation constituents and 2 cities of federal significance – Moscow and St.-Petersburg.
[2] Here and below, unless otherwise specifically stipulated, all the estimates are given in current prices.
[3] The typology of regions, commissioned by the Agency for Housing Mortgage Lending, was developed by IUE in 2011. The methodology for determining the typology of regions and the composition of regions in each group is available at: http://www.urbaneconomics.ru/research/project/tipology_IUE_2011
[4] The contribution of Moscow and St.-Petersburg’s economies was assessed against the total GRP of Moscow and the Moscow Region, of St.-Petersburg and the Leningrad Region.
[5] The typology was developed by IUE based on the typology of regions prepared by N.V. Zubarevich in 2005. Source: Russia of Regions: What Social Space Are We Living In? / Independent Institute For Social Policy. M: Pomatur, 2005. Available at: http://www.socpol.ru/publications/book.shtml. See the Annex for a detailed distribution of cities by groups.
Economies of Russia’s cities and metropolitan areas. Issue #2: The club of capital cities
